|
|
|
|
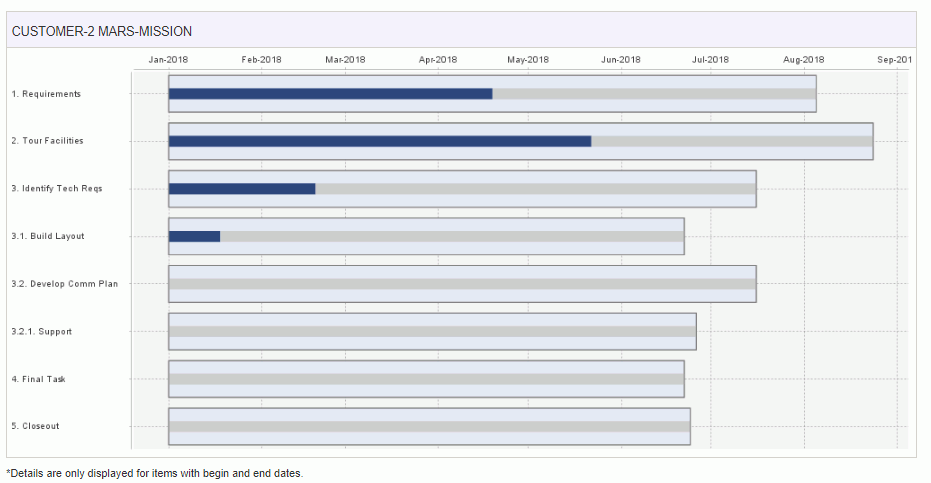
The Gantt chart feature allows the project manager to view a graphical representation of the tasks on a particular project. This feature is available via the Project >> Profile >> Reports/Charts >> Gantt Chart left menu item.
This chart will only include tasks that have both a start and end date populated. The date range of the entire chart will be based on the minimum and maximum task dates in your project.
The dark blue line running through the center of a tasks bar represents the % complete value for this task (as keyed in by the project manager or estimated if not provided).
Clicking on a particular Task bar will display the Task List with that particular task highlighted.

If your project has no tasks, or you have do not have any tasks w/ dates, you will get a screen indicating no details are available.